Analyzed Candidates
--
Bitcoin Astro Predictor | Version 2
This brief is a compact scientific-style summary derived from
RESEARCH/grid_search_massive_label_weighted_statistical_significance_tp_segment_weighted.ipynb
and top-100 grid-search significance results.
The objective is to test whether regime-segment alignment between astro-only model outputs and Bitcoin market structure is better than random.
Analyzed Candidates
--
Candidates With p < 0.05
--
Positive Effect Size (Δ > 0)
--
Combined Fisher p-value
--
Latest Market Date
--
Active Model eval_id
--
Interpretation: aggregate evidence is inconsistent with a purely random alignment model. The result supports the V2 statement: "weighted TP-segment alignment is non-random at aggregate level."
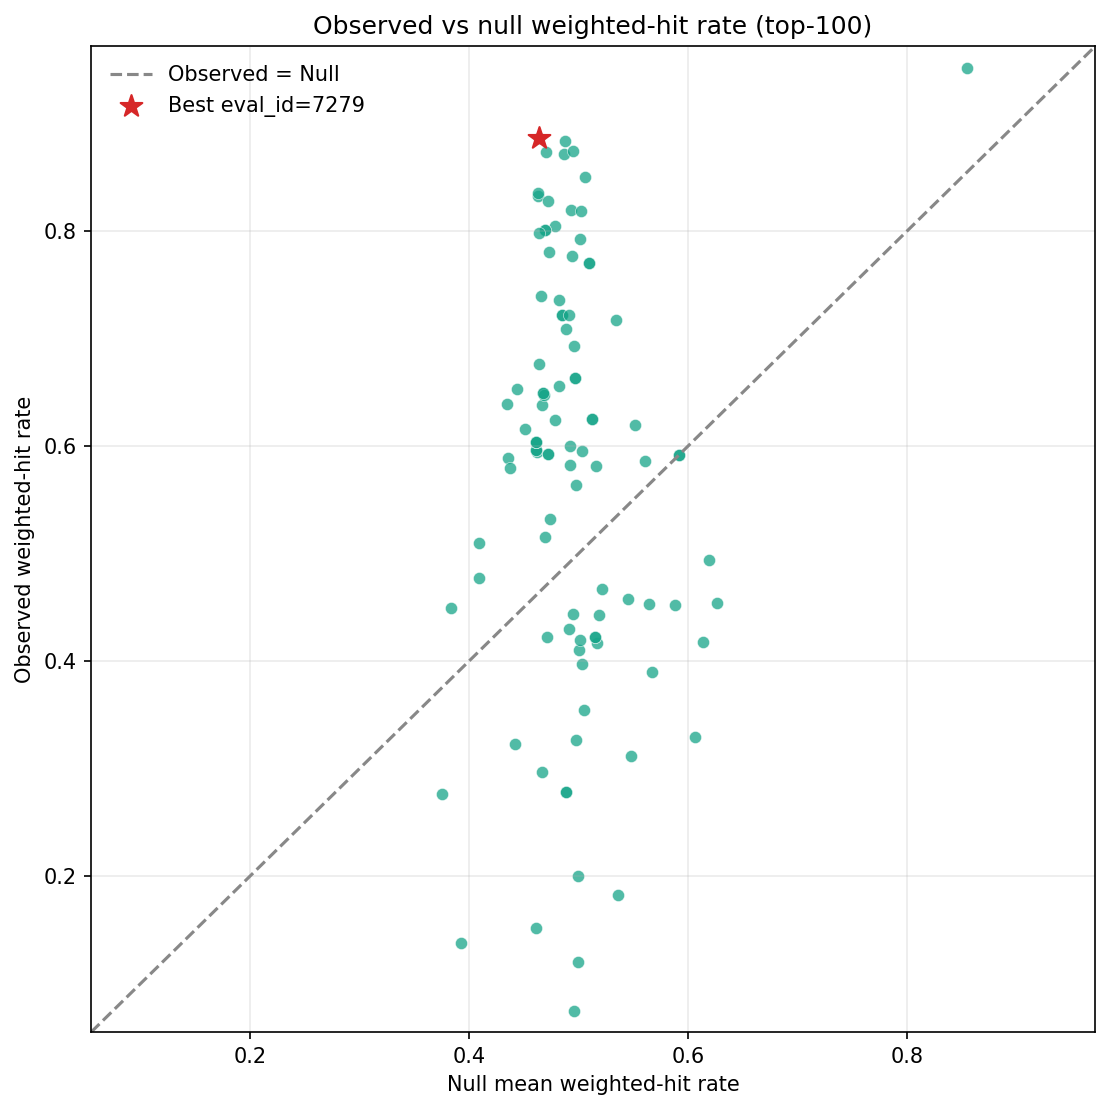
For each top candidate from the massive turning-point grid search, we compute a weighted segment-hit statistic and compare it to a permutation null.
The null preserves structure but randomizes alignment, producing an empirical p-value:
p_shift_weighted_hit.
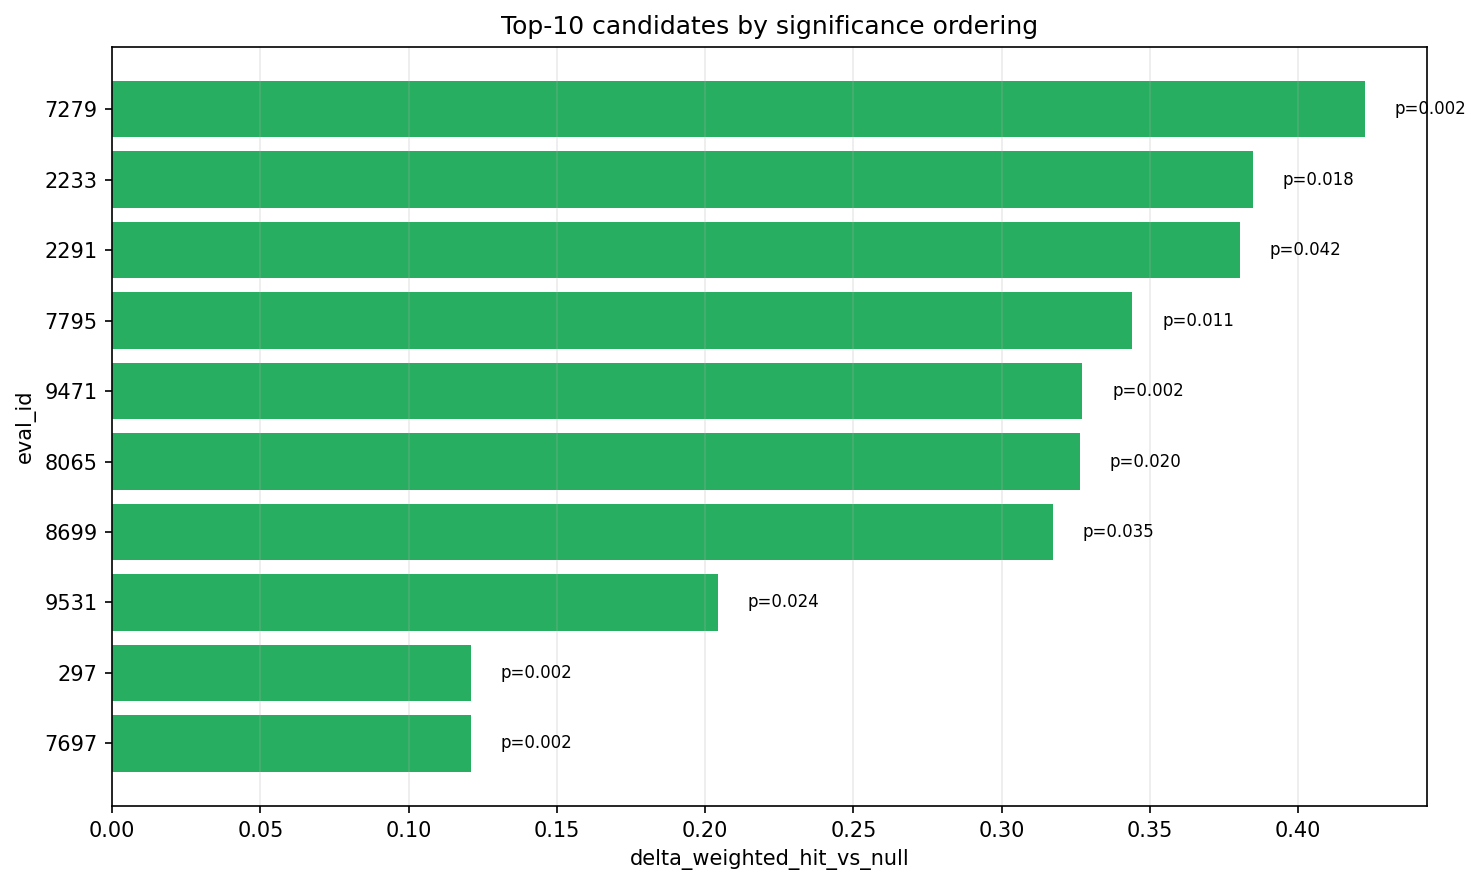
We then aggregate evidence across candidates using:
(1) sign test on effect direction (delta_weighted_hit_vs_null > 0),
(2) Fisher combined p-value,
(3) distributional plots and model-quality trade-off review.

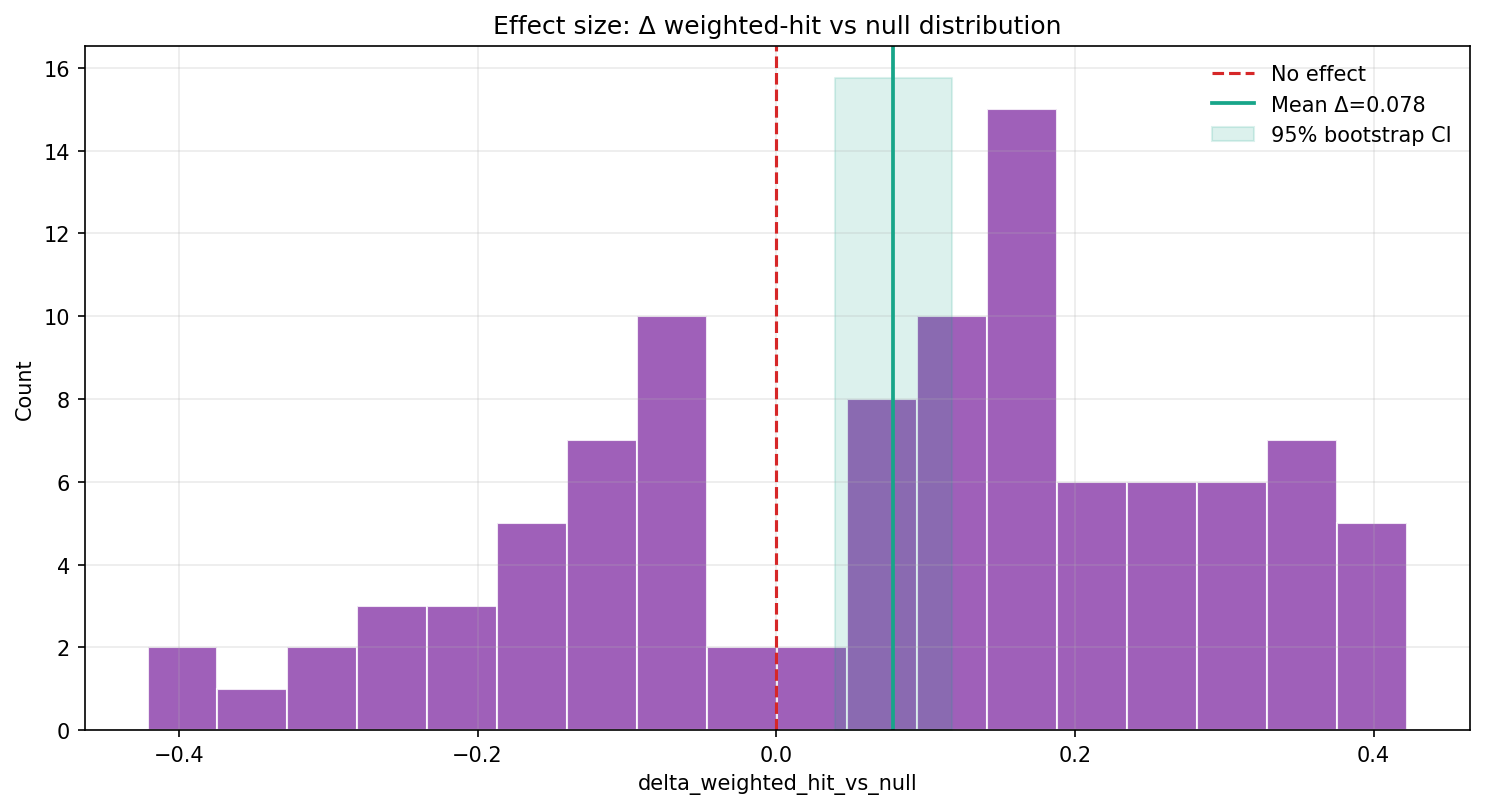
delta_weighted_hit_vs_null.
Mean effect is positive (0.078), bootstrap 95% CI [0.039, 0.118].
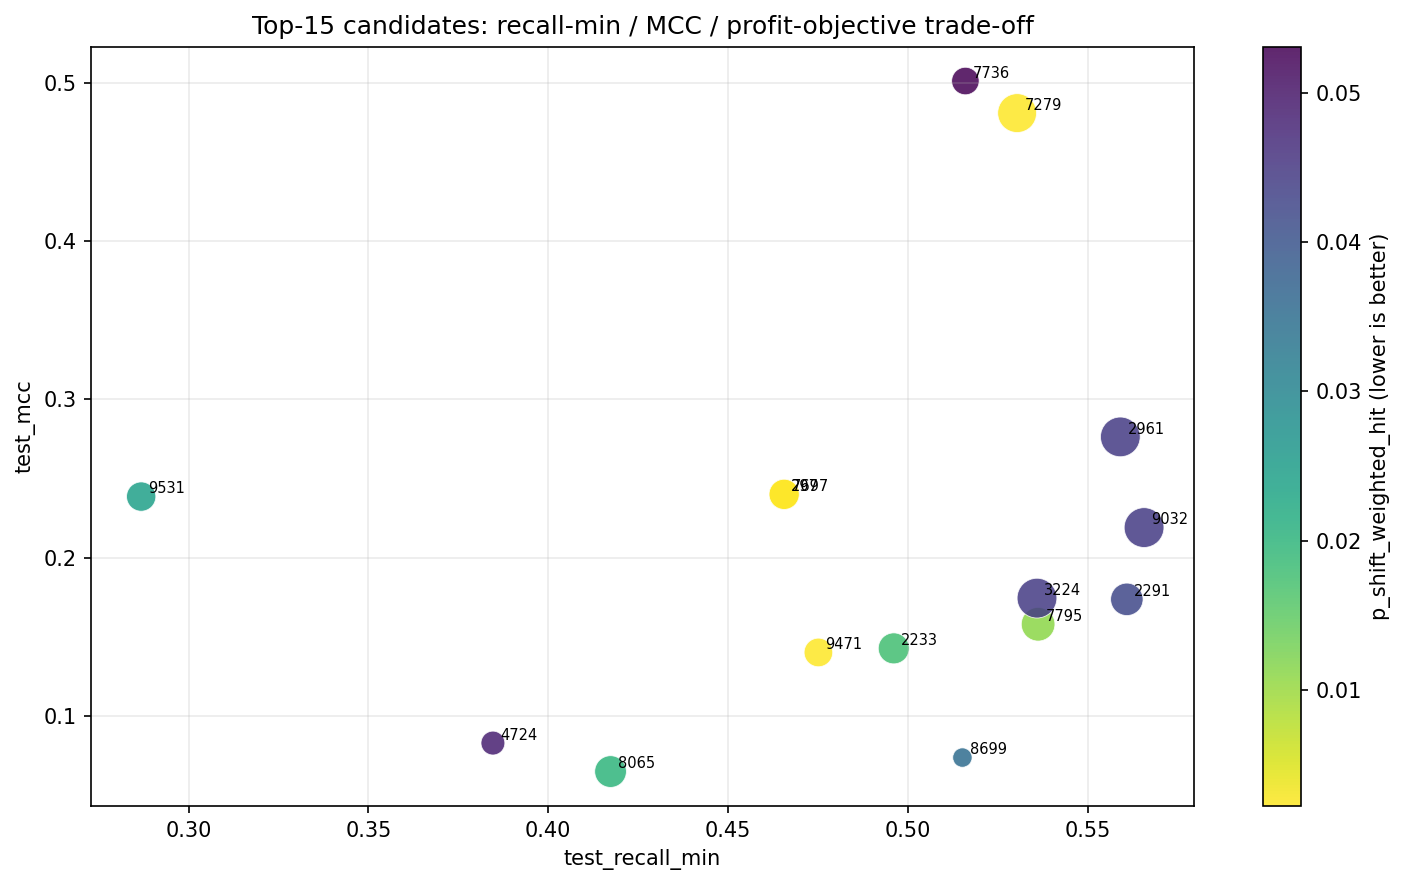
test_profit_y_obj.
| Metric | Value | Interpretation |
|---|---|---|
| p_shift_weighted_hit < 0.05 | -- | Concentration of low p-values is above random baseline expectation. |
| p_shift_weighted_hit < 0.01 | -- | Several candidates stay significant under stricter threshold. |
| Δ weighted-hit > 0 | -- | Directional tilt to positive effect size, not 50/50. |
| Sign test p-value | -- | Probability of 65+ positives out of 100 under random direction is very low. |
| Fisher combined p-value | -- | Aggregate evidence across candidate set is strongly non-random. |
| Stouffer combined z / p | -- | Independent aggregate test confirms positive global shift. |
| Mean Δ (bootstrap CI95) | -- | Effect-size center remains above zero under resampling. |
| Metric | Value |
|---|---|
| p_shift_weighted_hit | -- |
| delta_weighted_hit_vs_null | -- |
| weighted_hit_rate_obs / null_mean | -- |
| test_profit_y_obj | -- |
| test_recall_min | -- |
| test_recall_gap | -- |
| test_mcc | -- |
Verdict (V2): aggregate evidence supports non-random TP-segment alignment between astro-only model signals and Bitcoin regime structure.